The moving map display I demonstrated in the forty-five minute video in A Moving Map Display Using OpenStreetMap (2021) was the result of playing back a dataset I had collected in 2020 during a test of a u-blox UBX-NEO-M8U, a relatively complex piece of kit that included not only a Global Navigation Satellite System (GNSS) receiver but also an integrated Inertial Measurement Unit (IMU). I wanted to capture a moving map video in real-time just to remind myself that it could be done, so this morning I did just that.
The Overview
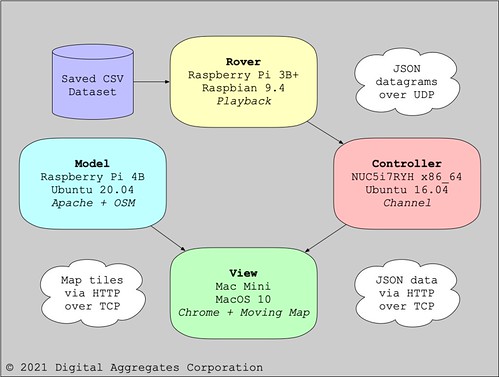
You might recall from that prior article, my implementation consists of four components.
The Rover is either a GNSS receiver connected to a computer running my Hazergpstool software to collect geolocation data in real-time, or a computer playing back such a dataset.
The Model is an OpenStreetMap (OSM) tile server that serves up graphical map segments and associated metadata via HTTP requests over TCP.
The View is your favorite modern web browser supporting JavaScript and HTML5 that renders the moving map using tiles fetched from the Model as it is steered by the Controller.
The Controller is a conduit that captures the datagrams of JSON data transmitted by the Rover over UDP and makes them available to the rest of the system via HTTP requests over TCP.
The Model, View, and Controller are all part my Tesoro project.
The Good Stuff
We'll start off with today's fifteen minute (14:49) video, captured on a display at my home base while I drove my Subaru WRX equipped with the Rover around the neighborhood. Feel free to skip around. (If the video doesn't show up for you, you can find it on YouTube. For best results, open the video up in a larger window, and select the High Definition version.)
The Test Setup
The Model was the same Raspberry Pi as before, running the OSM software stack as an Apache web application.
The View was my desktop Mac Mini with a Cinema Display, using QuickTime to capture the video from the Safari web browser running the Tesoro client-side movingmap JavaScript program.
The Controller was the Tesoro channel server-side JavaScript program running under Node.js on another Raspberry Pi. It is the same RPi I use as a Real-Time Kinematic (RTK) corrections server for Differential GNSS (DGNSS) for my Tumbleweed project.
The Rover consisted of a relatively inexpensive USB-connected receiver, a GlobalSat BU-353S4-5Hz, based on a SiRF Star IV chipset. (SiRF is a division of mobile phone chip maker Qualcomm). It was connected to a GPD MicroPC running Hazer's gpstool under Ubuntu MATE. The tiny palmtop computer was equipped with an external NovAtel MiFi USB730L LTE modem that it used to transmit its JSON datagrams containing geolocation data back to home base.
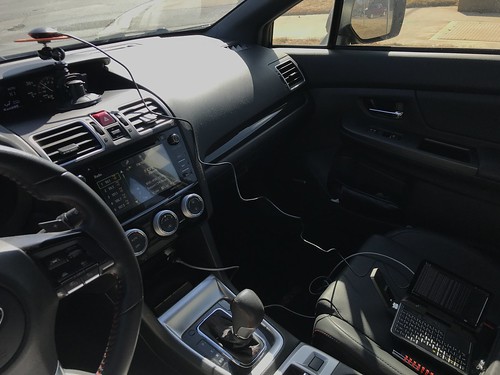
Here is the Rover sitting in the WRX during the test; the GPS receiver is at the far left on a mount on the dashboard, and the PC is sitting on the passenger seat at the far right with the LTE modem visible on its left side.
Here's a close up of the BU-353S4-5Hz receiver in my lab. The little USB dongle is not much larger than a wristwatch face, and includes the GPS receiver, the active (amplified) patch antenna, and the USB interface which provides both connectivity and power. It's magnetically mounted on a steel plate that serves as a ground plane, a reflective surface for GPS radio waves.
The GPD MicroPC, shown below on my lap bench with the LTE modem attached on its left side, is basically a pocket-sized ruggedized industrial PC. Although I don't do any touch typing on its chicklet keyboard, I really like the fact that the little Intel Celeron-equipped palmtop incorporates a lot of useful interfaces, including WiFi, an RJ45 Ethernet jack, and an RS232 serial port with a DB9 connector.
UDP vs. TCP
If you watch the video, and pay attention to the JavaScript console at the bottom, you will notice that the movingmap script occasionally reports missing JSON datagrams. This is typical of my experience in the field using LTE modems and the best effort User Datagram Protocol (UDP) to transmit geolocation updates to the home base. This causes the moving map display to briefly stall and then jump forward as it catches up to the real-time data.
As you might expect, using the guaranteed delivery Transmission Control Protocol (TCP) instead of UDP solves this problem. And indeed, my initial implementation years ago used TCP. But what I found during these kinds of real-time visualizations, especially in locations with spotty cellular reception, is that the display could lag many seconds behind real-time as the TCP/IP stack retransmitted lost packets. And once behind, it never caught up. In fact, it sometimes got progressively worse. It was far better to have the map pointer jump forward than to permanently and increasingly lag behind what was happening in meat-space.
I talked about this at length in Better Never Than Late (2017): in this particular real-time application, it is better to lose packets, or drop packets that arrive out of order, than it is to wait for the network stack to ensure perfect reliability. Besides, my Hazer software saves all the geolocation information on the Rover as a dataset of Comma Separated Values (CSV). So at worst, you can play back the dataset with perfect fidelity when the Rover returns to home base.
(Note: edited several times for corrections and clarity.)
Google Maps is a treasure. Hardly a day goes by that I don't use it. If I see a news item that interests me that includes an address, or even just a neighborhood, chances are good I'll be looking it up. By the time Mrs. Overclock and I got to Helsinki Finland to attend the World Science Fiction Convention in 2017, I had already "walked" all around the neighborhood of our hotel using Street View.
But although using Google Maps this way for me is free, it is a costly commercial product to develop and support. The maps have to be continuously updated with corrections and changes. The Street View images are routinely laboriously updated and ground truth established by humans driving extensively instrumented vehicles. The Satellite View images are updated frequently enough that I am often surprised to find that the season or the landscaping has changed since the last time I looked at my own neighborhood. It can't be cheap. Google supports this "free" service through a combination of fees for businesses that choose to advertise on this platform, and by licensing its use for products that use this platform for their own mapping needs.
By now, anyone reading my blog has come to realize that I have had a long running, broad, and deep, personal effort at writing applications using the U.S. Global Positioning System (GPS), and more broadly, other Global Navigation Satellite Systems (GNSS). More recently I branched out to include Inertial Measurement Units (IMU). This is part of my Hazer project, the source code repository for which can be found on GitHub. I am understandably interested in mapping the results of my tests, either in real-time or as part of my post-test analysis. Google Maps would have been ideal for this, but the price tag was a little high for something that amounts to an intensive hobby.
In my article Better Never Than Late (2017), I tracked a mobile GPS unit in my car by transmitting its geolocation data back to my home office via an LTE modem, to be mapped in real-time using Google Earth, an application program that provides a programmatic way to use satellite imagery. This worked great; but sometime between 2017 and 2018 the capability to do this in real-time with Google Earth stopped working. I was still able to do the post-test mapping by importing the data into Google Earth in Keyhole Markup Language (KML) form, as illustrated in my article Dead Reckoning(2020). But I wanted a solution for a real-time moving map display.
Recently I became aware of OpenStreetMap (OSM), an open-data, community-driven, project to provide an alternative to Google Maps for exactly the kind of real-time mapping in which I was interested. Thus was born another project, Tesoro, also hosted on GitHub, with the goal of incorporating OSM with Hazer to create a real-time moving map display.
Demonstration
Before I get to the nuts and bolts of Tesoro and OSM, let's go right to the good stuff: a video of the moving map display that I implemented. This is a forty-five minute (45:47) video, so no one (not even me) is going to want to watch all of it. But it's fun to skip around and watch different parts. For best results, watch this video in a separate YouTube window, and if your user interface supports it (not all do), choose the High Definition option so you can read the labels on the map. Opening it up into Full Screen mode helps too. Or be prepared to do a lot of squinting. (If the video below doesn't show up for you, try this link to the video on YouTube.)
This test used a playback of geolocation data I collected during IMU testing conducted on 2020-09-17. The playback mechanism uses the same UDP-based networking to feed the Hazer data stream to Tesoro that I have used previously in the field, so I would expect it to work almost as well with a real-time feed, subject to the occasional data loss I witnessed using LTE modems. (In Better Never Than Late I make the case as to why UDP, and not TCP, is the correct internet protocol to use for this. Alas, an efficient and easy to use method of encrypting and authenticating UDP traffic - while maintaining the characteristics of UDP that I find important - is in my opinion an unsolved problem.)
Overview
Tesoro broadly consists of four components: the Rover, the Model, the View, and the Controller. Web developers will recognize the Model-View-Controller (MVC) nomenclature used to describe a design pattern for interactive applications. GNSS developers will recognize Rover as the mobile portion of a Differential GNSS (DGNSS) system. (As always, you can click on any image to see a larger version.)
Although most of my development of Tesoro was done by running all of these components on a single computer, that didn't reflect how I expect the system to be used in real life. So for the video above, I split the components onto four different computers.
The Rover
The Rover plays the role of the component in the field, running the Hazer gpstool application and forwarding the resulting geolocation data via UDP back to the home base. For this test, the Rover was one of my Raspberry Pi 3B+ development machines running a version of the Debian Linux distro called Raspberry Pi OS (formerly called Raspbian).
gpstool saves geolocation data in a Comma Separated Value (CSV) format so it can be easily imported into a spreadsheet. The Hazer csvmeter script reads the stored CSV data and meters it out at approximately the same rate - typically 1Hz - as it was originally generated by the GNSS receiver under test. The output of csvmeter is piped to the Hazer csv2dgm utility that trivially converts it into JavaScript Object Notation (JSON) - the standard data serialization format used by JavaScript and lots of other applications because it is far simpler than eXtensible Markup Language (XML) - and sends the resulting datagram on its way.
The Rover can be tested by using the Linux/GNU utility socat to receive the datagrams and display them on the console.
The Model
The Model (short for Data Model) provides the database of map data used by the moving map display. The Model is an OpenStreetMap tile server, a server-side web application and database that provides tiles - graphical map segments - via Hyper Text Transfer Protocol (HTTP). It is hosted on a Raspberry Pi 4B computer with a two terabyte (2TB) Solid State Disk (SSD) in addition to its own root file system on a microSDcard.
This tiny Single Board Computer (SBC) runs, not the typical Raspbian, but a full blown version of Ubuntu, another Debian-based Linux distro. I chose Ubuntu over the usual Raspbian that I run on the other ten Raspberry Pis that run 24x7 at the Palatial Overclock Estate because the OSM stack was known to work under Ubuntu. Could it run under Raspbian? Got me. When I found out that there were instructions for installing OSM under Ubuntu 20.04, and there was a version of Ubuntu 20.04 that could be installed on the Raspberry Pi 4B, I looked no further. Installing Ubuntu, then the entire OSM stack, then the map data for North America, then building the map database, on the Raspberry Pi was a relatively simple but time-consuming process.
I was careful to keep the map dataset (which is very large) and the Postgres database (which is very active) on the SSD. Given that just today I saw an ad for a one terabyte (1TB) microSDcard, it might be possible to implement a tile server without the SSD.
The Model can be tested by issuing an appropriate HTTP request from a browser or the Linux/GNU command line utility wget and seeing what comes back.
The Controller
The Controller provides the data stream that steers the moving map. It is implemented by channel, a small server-side JavaScript program I wrote that stands up a microscopic HTTP server. The channel receives the JSON datagrams from the Rover via UDP and caches the most recent one. When channel receives an HTTP request of any kind (it's not picky) over TCP, it responds by replying with the latest JSON datagram.
The channel is merely the conduit through which the JSON datagrams from the Rover can be received by the client-side web browser a.k.a. the View. Non-web developers may be surprised (I was) at how difficult this simple requirement is to solve. Browser security is an ever tightening chain of rules and sandboxing designed to keep malicious web sites from stealing your identity or infecting your laptop with malware. A lot of solutions you might take for granted as being feasible are actually deliberately impossible.
JavaScript programs running on the server-side under the standard Node.js compiler/interpreter have no such restrictions, however. I ran the channel JavaScript program on one of my x86_64 Ubuntu development systems, but any Linux/GNU system running Node.js would do.
The Controller can be tested by running channel and then making a web request using a browser or wget.
The View
The View is the visualization engine of Tesoro. It consists of a lot of client-side JavaScript code running inside of the web browser of your choice, being steered by the JSON it periodically fetches via HTTP from the Controller, and then rendering the appropriate map segments it requests from the Model. The View is implemented by a combination of Hyper Text Markup Language (HTML) files that download and run my movingmap JavaScript program. movingmap is built on top of Leaflet (1.7.1), a widely used JavaScript library that provides a client-side API to OSM. It is Leaflet that does all of the heavy lifting with OSM.
The View client-side HTML and JavaScript code (including Leaflet) are hosted on the Model, the OSM tile server, as just another Apache web site application. They are downloaded and executed inside the web browser on whatever computer the browser is running on. You can probably run the View on any modern web browser that supports JavaScript. The video above was recorded with QuickTime using the Google Chrome browser running on my desktop Apple Mac mini running macOS 10 with an Apple Cinema Display. But I have also run the View with Firefox on an x86_64 Ubuntu system, and with both Firefox and Safari on the same Mac.
Tesoro includes several HTML web pages that can be used to incrementally test the View and the rest of the software stack, first displaying a static map at a fixed location, then a static map whose latitude and longitude are specified as a query in the Uniform Resource Locator (URL), then finally as dynamic moving map display being steered by a user-specified channel.
Details
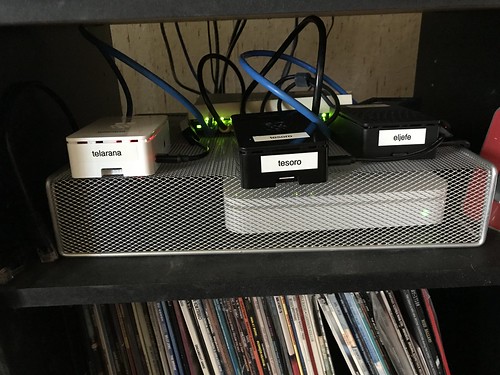
This is an image of the Raspberry Pi that is the OpenStreetMap tile server (center). It resides in an old stereo rack alongside my web server (left), and a Real-Time Kinematic (RTK) update server (right) that is part of my DGNSS project.
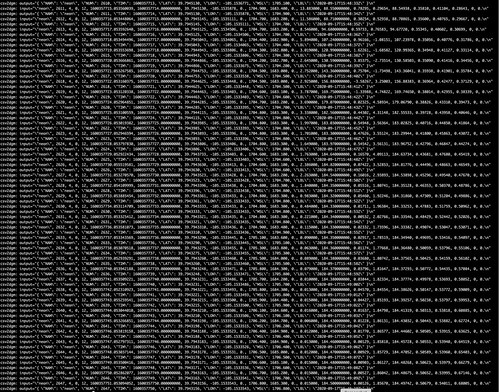
This is the console output of the Rover's csv2dgm utility, which is written in C and is part of Hazer. When debugging output is enabled, csv2dgm displays both the incoming CSV record and the outgoing JSON datagram.
Although for this example I was playing back a dataset of CSV records previously recorded as part of an actual field test, the same csv2dgm utility is used in the script that runs on the Rover in the field; this output is an easy way to verify that the Rover is generating datagrams before deploying it.
The Controller's channel JavaScript program that runs under Node.js is pretty chatty as well. Every time it receives a datagram over UDP, it displays its JSON payload as well as the sender from which it was received. Every time the View (or anyone else) issues an HTTP request over TCP, the program displays the requestor and the JSON it was sent.
This output is especially useful since it can be saved as a permanent record on the local computer on which channel runs, independent on to whether the CSV dataset saved on the Rover in the field is eventually recovered.
All three of the web browsers I tested with - Chrome, Firefox, and Safari - have very useful debugging tools built in. In this screen shot from the video above, you can see the moving map on the left, and an optional console log on the right. Tesoro's movingmap client-side JavaScript program makes use of this log to reveal what it is doing. All three browsers have a console log like this, variously called "JavaScript Console", "Web Console", or a "Console" tab on a "Developer Tools" window.
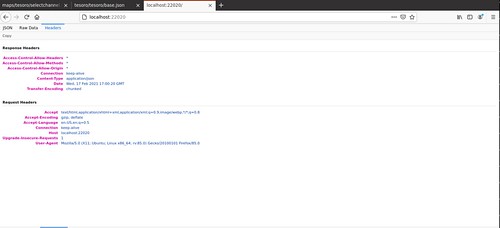
All three browsers also have tools to examine the headers used in the HTTP protocol. This is useful for debugging all three components, Model, View, and Controller, since all use HTTP.
The README file for the Tesoro repository on GitHub has links to the pages I used to learn how to install Ubuntu on the Raspberry Pi, to install the OSM software stack, to download the map data, and to build the Postgres database, all on the Model tile server.
In addition, the repository includes a text file of mostly unstructured notes that might be useful if you get stuck trying to reproduce my results. Be aware, though, that not all of the notes led to something I actually used or did; some were dead ends.
Conclusions
I'm a little surprised how well this project worked, mostly because I wasn't a web developer when I started it. I'm not a web developer now, either. JavaScript will not be appearing on my LinkedIn profile.
But thanks to having hacked other developer's JavaScript on various paying gigs that had a web component, and to the wealth of documentation I found online, I was able - as usual - to learn from people smarter than myself.
(Note: edited several times for corrections and clarity.)
The human brain is so wired for detecting patterns, our desire for order in a universe ruled by chaotic behavior so great, our need for a narrative so ingrained, that we detect patterns and create a narrative from them that implies order, even when there is no actual story to be told. It is both our greatest weakness and our greatest strength. Which is why we need to stick to the scientific method and be evidence based. That is a kind of narrative generation too, but it is a story we reject when it no longer matches the facts at hand. Many synthesized narratives imply order when reality may be nothing more than rational but uncorrelated actors responding similarly to a common set of incentives.
I think about time a lot. I have a cesium atomic clock "ticking" away in my living room. I've stood alongside one of the official cesium frequency references, and also the experimental ytterbium optical atomic clock, at the NIST laboratories in Boulder Colorado.
For a long time, I thought there wasn't really any such thing as time per se, only events connected by causality. After all, all of our means of measuring time have to do with counting events that occur in some naturally occurring resonator: pendulum, quartz crystal, cesium atom, etc. This is a point of view held by at least some research physicists, so it's not a completely crazy idea.
But in one of Dr. Sabine Hossenfelder's blog posts, a commenter mentioned the effects of special and general relativity on our measurement of time, in which acceleration and gravity wells, respectively, slow time down, according to those very same resonators. That comment completely changed my world view. So now I think time is a real thing, not just a measurement artifact.
Next thing to think about: why does time play a role in the large (classical physics, cosmology, etc.) but not in the very small (where it doesn't appear as a factor in the equations used by quantum physicists)?
Separately: what sometimes keeps me awake at night (really) is that there is much evidence that at both the quantum (Bell's Theorem) and cosmological ("block time" a.k.a. "block universe") level, reality appears to be super deterministic: both the past and the future are fixed, and we are just passive observers playing our roles as we move along the timeline. We can't predict the future; but we can't change it either.
You may have read by now that the online vaccine management system that the Trump administration paid US$44M for from the consulting firm Deloitte in a no-bid contract is a disaster. Riddled with bugs like making and then randomly cancelling appointments. States are giving up and cobbling together their own solutions.
About half my career has been spent doing work funded by the U.S. government, either in Big Science or in the Military and Intelligence sector. What I found the most interesting about this mess is one of the reasons Deloitte got the non-competitive contract in the first place. Did they have any experience in large scalable distributed medical computer systems? No. Infectious diseases? Nope. Vaccination programs? Not even. What they had experience in is government contracting. And the procurement systems implemented by the feds make it difficult - not to mention less profitable, compared to other work in the commercial sector - for anyone who isn't already doing government contracting to do government contracting.
I'm reminded of when Google bought Boston Dynamics. The robot company had been mostly funded by DARPA, the U.S. DoD's advanced research arm, the folks that have a track record of bringing us things like the Internet. Once Google bought Boston Dynamics, they declined to renew the DARPA contract. The DoD-related industry was surprised; I read articles in the DoD trade and national security press about this at the time. But I doubt many in the high tech industry even batted an eye. Selling to the Feds used to be a big thing. Now, not so much, compared to the global market. (Google eventually sold the company to Hyundai. Yet another bleeding edge albeit immature technology transferred to a foreign company.)
Another issue that occurs to me is how long it takes to design, develop, test, and deploy a product as big and complex as the proposed vaccine management system. Contrary, I suspect, to expectations in the White House at the time, a commercial effort of this type would take a year or two, all told. Regardless of the sales pitch from any consulting company, there is no fast path. That's why you have to anticipate this kind of need, and address it well in advance of it becoming a necessity. It's like insurance: you have to buy it before you need it, with the understanding - and the hope - that you never actually have to use it.
Chip Overclock® is a megalomaniacal supervillain and the secret identity, pseudonym, alter ego, and registered trademark of John Sloan, a technology product developer who specializes in very large and very small systems on the internet of interesting things: distributed, real-time, high performance, high altitude, embedded, concurrent, parallel, asynchronous, remote, close to bare metal.