Google Maps is a treasure. Hardly a day goes by that I don't use it. If I see a news item that interests me that includes an address, or even just a neighborhood, chances are good I'll be looking it up. By the time Mrs. Overclock and I got to Helsinki Finland to attend the World Science Fiction Convention in 2017, I had already "walked" all around the neighborhood of our hotel using Street View.
But although using Google Maps this way for me is free, it is a costly commercial product to develop and support. The maps have to be continuously updated with corrections and changes. The Street View images are routinely laboriously updated and ground truth established by humans driving extensively instrumented vehicles. The Satellite View images are updated frequently enough that I am often surprised to find that the season or the landscaping has changed since the last time I looked at my own neighborhood. It can't be cheap. Google supports this "free" service through a combination of fees for businesses that choose to advertise on this platform, and by licensing its use for products that use this platform for their own mapping needs.
By now, anyone reading my blog has come to realize that I have had a long running, broad, and deep, personal effort at writing applications using the U.S. Global Positioning System (GPS), and more broadly, other Global Navigation Satellite Systems (GNSS). More recently I branched out to include Inertial Measurement Units (IMU). This is part of my Hazer project, the source code repository for which can be found on GitHub. I am understandably interested in mapping the results of my tests, either in real-time or as part of my post-test analysis. Google Maps would have been ideal for this, but the price tag was a little high for something that amounts to an intensive hobby.
In my article Better Never Than Late (2017), I tracked a mobile GPS unit in my car by transmitting its geolocation data back to my home office via an LTE modem, to be mapped in real-time using Google Earth, an application program that provides a programmatic way to use satellite imagery. This worked great; but sometime between 2017 and 2018 the capability to do this in real-time with Google Earth stopped working. I was still able to do the post-test mapping by importing the data into Google Earth in Keyhole Markup Language (KML) form, as illustrated in my article Dead Reckoning (2020). But I wanted a solution for a real-time moving map display.
Recently I became aware of OpenStreetMap (OSM), an open-data, community-driven, project to provide an alternative to Google Maps for exactly the kind of real-time mapping in which I was interested. Thus was born another project, Tesoro, also hosted on GitHub, with the goal of incorporating OSM with Hazer to create a real-time moving map display.
Demonstration
Before I get to the nuts and bolts of Tesoro and OSM, let's go right to the good stuff: a video of the moving map display that I implemented. This is a forty-five minute (45:47) video, so no one (not even me) is going to want to watch all of it. But it's fun to skip around and watch different parts. For best results, watch this video in a separate YouTube window, and if your user interface supports it (not all do), choose the High Definition option so you can read the labels on the map. Opening it up into Full Screen mode helps too. Or be prepared to do a lot of squinting. (If the video below doesn't show up for you, try this link to the video on YouTube.)
This test used a playback of geolocation data I collected during IMU testing conducted on 2020-09-17. The playback mechanism uses the same UDP-based networking to feed the Hazer data stream to Tesoro that I have used previously in the field, so I would expect it to work almost as well with a real-time feed, subject to the occasional data loss I witnessed using LTE modems. (In Better Never Than Late I make the case as to why UDP, and not TCP, is the correct internet protocol to use for this. Alas, an efficient and easy to use method of encrypting and authenticating UDP traffic - while maintaining the characteristics of UDP that I find important - is in my opinion an unsolved problem.)
Overview
Tesoro broadly consists of four components: the Rover, the Model, the View, and the Controller. Web developers will recognize the Model-View-Controller (MVC) nomenclature used to describe a design pattern for interactive applications. GNSS developers will recognize Rover as the mobile portion of a Differential GNSS (DGNSS) system. (As always, you can click on any image to see a larger version.)
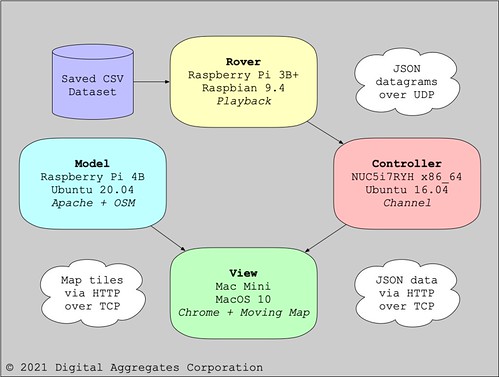
Although most of my development of Tesoro was done by running all of these components on a single computer, that didn't reflect how I expect the system to be used in real life. So for the video above, I split the components onto four different computers.
The Rover
The Rover plays the role of the component in the field, running the Hazer gpstool application and forwarding the resulting geolocation data via UDP back to the home base. For this test, the Rover was one of my Raspberry Pi 3B+ development machines running a version of the Debian Linux distro called Raspberry Pi OS (formerly called Raspbian).
gpstool saves geolocation data in a Comma Separated Value (CSV) format so it can be easily imported into a spreadsheet. The Hazer csvmeter script reads the stored CSV data and meters it out at approximately the same rate - typically 1Hz - as it was originally generated by the GNSS receiver under test. The output of csvmeter is piped to the Hazer csv2dgm utility that trivially converts it into JavaScript Object Notation (JSON) - the standard data serialization format used by JavaScript and lots of other applications because it is far simpler than eXtensible Markup Language (XML) - and sends the resulting datagram on its way.
The Rover can be tested by using the Linux/GNU utility socat to receive the datagrams and display them on the console.
The Model
The Model (short for Data Model) provides the database of map data used by the moving map display. The Model is an OpenStreetMap tile server, a server-side web application and database that provides tiles - graphical map segments - via Hyper Text Transfer Protocol (HTTP). It is hosted on a Raspberry Pi 4B computer with a two terabyte (2TB) Solid State Disk (SSD) in addition to its own root file system on a microSDcard.

This tiny Single Board Computer (SBC) runs, not the typical Raspbian, but a full blown version of Ubuntu, another Debian-based Linux distro. I chose Ubuntu over the usual Raspbian that I run on the other ten Raspberry Pis that run 24x7 at the Palatial Overclock Estate because the OSM stack was known to work under Ubuntu. Could it run under Raspbian? Got me. When I found out that there were instructions for installing OSM under Ubuntu 20.04, and there was a version of Ubuntu 20.04 that could be installed on the Raspberry Pi 4B, I looked no further. Installing Ubuntu, then the entire OSM stack, then the map data for North America, then building the map database, on the Raspberry Pi was a relatively simple but time-consuming process.
I was careful to keep the map dataset (which is very large) and the Postgres database (which is very active) on the SSD. Given that just today I saw an ad for a one terabyte (1TB) microSDcard, it might be possible to implement a tile server without the SSD.
The Model can be tested by issuing an appropriate HTTP request from a browser or the Linux/GNU command line utility wget and seeing what comes back.
The Controller
The Controller provides the data stream that steers the moving map. It is implemented by channel, a small server-side JavaScript program I wrote that stands up a microscopic HTTP server. The channel receives the JSON datagrams from the Rover via UDP and caches the most recent one. When channel receives an HTTP request of any kind (it's not picky) over TCP, it responds by replying with the latest JSON datagram.
The channel is merely the conduit through which the JSON datagrams from the Rover can be received by the client-side web browser a.k.a. the View. Non-web developers may be surprised (I was) at how difficult this simple requirement is to solve. Browser security is an ever tightening chain of rules and sandboxing designed to keep malicious web sites from stealing your identity or infecting your laptop with malware. A lot of solutions you might take for granted as being feasible are actually deliberately impossible.
JavaScript programs running on the server-side under the standard Node.js compiler/interpreter have no such restrictions, however. I ran the channel JavaScript program on one of my x86_64 Ubuntu development systems, but any Linux/GNU system running Node.js would do.
The Controller can be tested by running channel and then making a web request using a browser or wget.
The View
The View is the visualization engine of Tesoro. It consists of a lot of client-side JavaScript code running inside of the web browser of your choice, being steered by the JSON it periodically fetches via HTTP from the Controller, and then rendering the appropriate map segments it requests from the Model. The View is implemented by a combination of Hyper Text Markup Language (HTML) files that download and run my movingmap JavaScript program. movingmap is built on top of Leaflet (1.7.1), a widely used JavaScript library that provides a client-side API to OSM. It is Leaflet that does all of the heavy lifting with OSM.
The View client-side HTML and JavaScript code (including Leaflet) are hosted on the Model, the OSM tile server, as just another Apache web site application. They are downloaded and executed inside the web browser on whatever computer the browser is running on. You can probably run the View on any modern web browser that supports JavaScript. The video above was recorded with QuickTime using the Google Chrome browser running on my desktop Apple Mac mini running macOS 10 with an Apple Cinema Display. But I have also run the View with Firefox on an x86_64 Ubuntu system, and with both Firefox and Safari on the same Mac.
Tesoro includes several HTML web pages that can be used to incrementally test the View and the rest of the software stack, first displaying a static map at a fixed location, then a static map whose latitude and longitude are specified as a query in the Uniform Resource Locator (URL), then finally as dynamic moving map display being steered by a user-specified channel.
Details
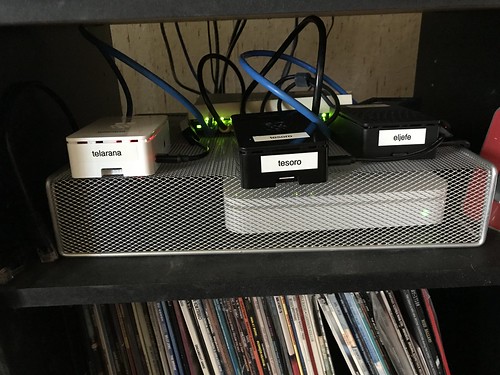
This is an image of the Raspberry Pi that is the OpenStreetMap tile server (center). It resides in an old stereo rack alongside my web server (left), and a Real-Time Kinematic (RTK) update server (right) that is part of my DGNSS project.
This is the console output of the Rover's csv2dgm utility, which is written in C and is part of Hazer. When debugging output is enabled, csv2dgm displays both the incoming CSV record and the outgoing JSON datagram.
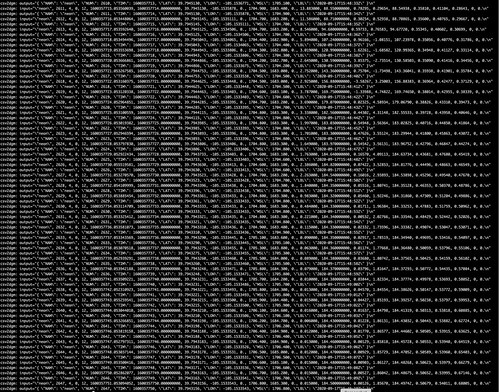
Although for this example I was playing back a dataset of CSV records previously recorded as part of an actual field test, the same csv2dgm utility is used in the script that runs on the Rover in the field; this output is an easy way to verify that the Rover is generating datagrams before deploying it.
The Controller's channel JavaScript program that runs under Node.js is pretty chatty as well. Every time it receives a datagram over UDP, it displays its JSON payload as well as the sender from which it was received. Every time the View (or anyone else) issues an HTTP request over TCP, the program displays the requestor and the JSON it was sent.

This output is especially useful since it can be saved as a permanent record on the local computer on which channel runs, independent on to whether the CSV dataset saved on the Rover in the field is eventually recovered.
All three of the web browsers I tested with - Chrome, Firefox, and Safari - have very useful debugging tools built in. In this screen shot from the video above, you can see the moving map on the left, and an optional console log on the right. Tesoro's movingmap client-side JavaScript program makes use of this log to reveal what it is doing. All three browsers have a console log like this, variously called "JavaScript Console", "Web Console", or a "Console" tab on a "Developer Tools" window.

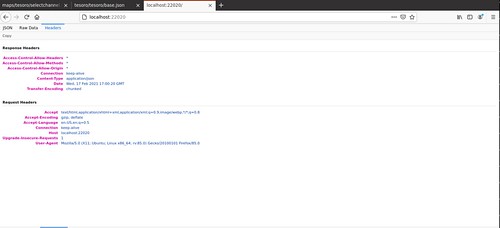
All three browsers also have tools to examine the headers used in the HTTP protocol. This is useful for debugging all three components, Model, View, and Controller, since all use HTTP.
The README file for the Tesoro repository on GitHub has links to the pages I used to learn how to install Ubuntu on the Raspberry Pi, to install the OSM software stack, to download the map data, and to build the Postgres database, all on the Model tile server.
In addition, the repository includes a text file of mostly unstructured notes that might be useful if you get stuck trying to reproduce my results. Be aware, though, that not all of the notes led to something I actually used or did; some were dead ends.
Conclusions
I'm a little surprised how well this project worked, mostly because I wasn't a web developer when I started it. I'm not a web developer now, either. JavaScript will not be appearing on my LinkedIn profile.
But thanks to having hacked other developer's JavaScript on various paying gigs that had a web component, and to the wealth of documentation I found online, I was able - as usual - to learn from people smarter than myself.
(Note: edited several times for corrections and clarity.)


No comments:
Post a Comment