Sometimes I need a moving map display in real-time to track my projects at they move around in the field. Sometimes I want to playback a stored dataset of geolocation coordinates. And sometimes I want to see a static route map that shows the path a project took in the field. This latest addition to my Tesoro project does that. As before, it uses the Leaflet client-side JavaScript library and an OpenStreetMap tile server.
Here are a couple of static route maps generated from geolocation datasets collected from field testing. (You can click on either one to see a larger version.)
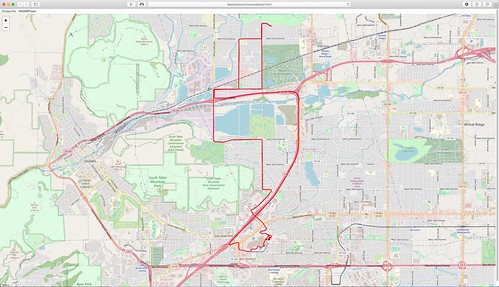
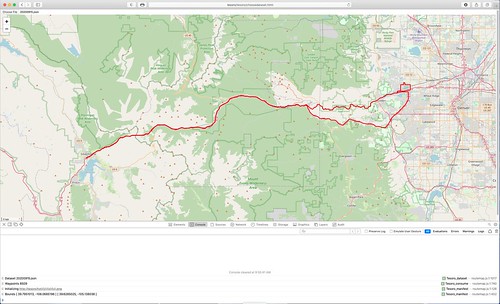
This new feature adds another web page, choosedataset.html, and another client-side JavaScript program, routemap.js, to the project. As with the moving map display, occasionally useful information is displayed in the browser's JavaScript log, as shown in the second image.
(Blogger kind of sucks for rendering code. Each example below in the monospace font is intended to be a single line.)
My Hazer C-based GNSS software stores geolocation data in a Comma Separated Value (CSV) format that makes it simple to import into spreadsheets and to post process for other uses. Each line of the CSV dataset looks like this.
"neon", 1299, 4, 0, 10, 1600356403.090779879, 1600356402.000000000, 39.7328371, -105.1543085, 0., 1766.500, 1745.000, 0., 4.948000, 127.340000000, -1.10049, 0.40705, 127.34082, 0.52130, 0.46396, 1.12472, 0, 0\n
My moving map display described in A Moving Map Display Using OpenStreetMap and subsequent articles steers the moving map, in real-time or in playback, using JSON datagrams, each datagram containing the coordinates for the next point. Each individual datagram looks like this.
{ "NAM": "neon", "NUM": 1300, "TIM": 1600356403, "LAT": 39.7328281, "LON": -105.1542851, "MSL": 1766.500, "LBL": "2020-09-17T15:26:43Z" }\n
The dataset used by the static route map is a JSON object containing an array of latitude and longitude coordinates. All of the points on the route are contained in a single array that is imported by the new software and stored in memory for processing. The dataset looks like this (although is typically much larger).
{ "PATH": [ [ 39.7762445, -105.1621035 ], [ 39.7762428, -105.1622863 ], [ 39.7762416, -105.1624700 ], [ 39.7762408, -105.1626533 ], [ 39.7762401, -105.1628366 ], [ 39.7762396, -105.1630200 ] ] }
Hazer contains scripts to convert its CSV format into JSON datagrams for playback
csvplayback 192.168.1.253:tesoro dat/yodel/20200917/vehicle.csv
or in real-time
csvfollow 192.168.1.253:tesoro dat/yodel/20200915/vehicle.csv
or into a JSON dataset
csvdataset < dat/yodel/20200915/vehicle.csv > vehicle.json
which can be used directly by the Tesoro map software.
Because the JSON object for the static route map has to all be stored in memory for processing by the Leaflet library, there is a limit to how many points you can render at a time. I ran into the same issue using the XML-based Keyhole Markup Language (KML) when rendering routes with Google Earth. But the second image above rendered a dataset of more than 8500 data points, collected from a field test almost two and a half hours long, with no discernible delay.
But for those really large datasets, the Hazer csvdataset script takes an optional modulo argument to sample the incoming CSV data. The Hazer gpstool utility stores CSV records at approximately 1Hz. So an argument of 10 would sample every tenth data point, capturing the target location about every ten seconds. But no matter the argument value, the first and last data points are included so that the start and end of the route is always rendered.
csvdataset 10 < dat/yodel/20200915/vehicle.csv > vehicle.json


No comments:
Post a Comment